qEEG Brain Mapping for Clinical Care: When It Helps Epilepsy and Dementia
September 11, 2026

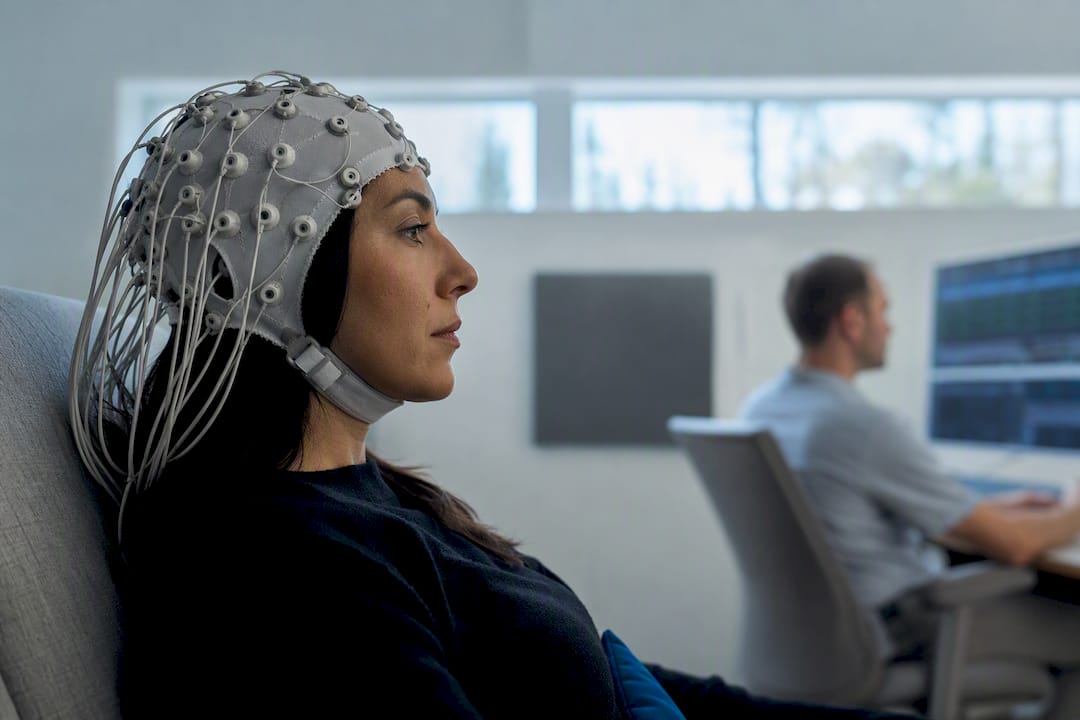
qEEG brain mapping is the quantitative analysis of scalp EEG signals, turned into color-coded maps and numerical scores that clinicians use to assess how your brain is functioning. It works as an adjunctive tool for treatment planning and monitoring, not a standalone diagnosis. The evidence is strongest for epilepsy localization and certain dementia workups, while psychiatric applications like ADHD and depression remain promising but still investigational.
TL;DR:
- qEEG brain mapping provides valuable data for epilepsy localization and dementia assessment but remains investigational for conditions like ADHD and depression.
- The analysis relies on measuring power in specific frequency bands, with interpretation heavily dependent on normative databases, artifact handling, and clinician expertise.
- It visualizes brain activity through color-coded maps, where patterns such as excess theta or slowed alpha are common, but their clinical significance depends on context.
- qEEG is primarily useful for guiding individualized neurofeedback protocols and tracking electrophysiological changes over time, not for standalone diagnosis.
- Proper interpretation requires qualified clinicians, large validated databases, and consideration of limitations like source localization accuracy and multiple comparison artifacts.
A routine EEG is a visual read. A neurologist looks at squiggly lines on a screen and flags spikes, slowing, or seizure activity by eye. qEEG takes that same raw electrical signal and runs it through mathematical analysis, converting brainwave activity into measurable numbers you can compare against a reference population. That distinction matters when you’re trying to understand why your provider might recommend one over the other.
The core unit of quantitative EEG analysis is “power,” which describes how much electrical activity exists within a specific frequency band at a given location on your scalp. Your brain doesn’t produce one steady wave. It produces a mix of frequencies, and each one tends to associate with different mental states:
Getting from raw voltage to those frequency bands requires a mathematical step called the Fast Fourier Transform, or FFT. Think of FFT as unmixing a chord back into its individual notes. It takes a chunk of EEG signal, called an epoch, and decomposes it into the frequencies present and how strong each one is. Wavelet analysis does something similar but tracks how frequency content changes moment to moment, which makes it better suited for catching brief events like a spike or a transient burst.
Epoch length changes what you can see. A 1-second epoch gives you 1 Hz frequency resolution, according to technical overviews of quantitative EEG methodology, while longer epochs sharpen frequency detail at the cost of temporal precision. Clinicians pick epoch length based on what they’re hunting for. Someone chasing sleep architecture picks differently than someone hunting a fast cognitive event.
Two more concepts matter once you move past basic power maps. Connectivity (sometimes called coherence) measures how synchronized activity is between two brain regions, essentially asking whether two areas are “talking” in a coordinated rhythm or working independently. Source localization, most commonly done with LORETA or its refined version sLORETA, attempts to estimate where inside the brain a given scalp signal originated, rather than just where it showed up on the scalp surface. That’s a meaningful upgrade over flat topographic maps, but it comes with real caveats: source localization depends on scalp coverage and assumptions about head anatomy, and it can’t match the spatial precision of an MRI-based scan. qEEG tells you brain activity with excellent timing; it doesn’t tell you brain structure with the same certainty a structural scan does.
If you’ve never had a qEEG, the process is more low-key than the imagery in movies suggests. A technician measures your scalp and places electrodes using the International 10-20 system, a standardized grid named for the fact that electrodes sit at intervals of 10% or 20% of measured skull distances. This keeps electrode placement consistent from one patient to the next and from one clinic to another, which matters enormously when your results get compared against a reference database.
A full clinical session typically includes:
Sampling rate is the technical detail patients rarely ask about but should. Most clinical systems record at 250 to 512 Hz, and the Nyquist principle means your system can only accurately capture frequencies up to half your sampling rate. A system with a low sampling rate simply cannot resolve high-frequency beta or gamma activity reliably, so the equipment itself sets a ceiling on what a qEEG can detect.
Raw EEG is messy. Eye blinks, jaw clenching, muscle tension, even a nearby cell phone can all create artifacts that look like brain activity but aren’t. Preprocessing typically involves visual review by a trained technician, Independent Component Analysis (ICA) to mathematically separate brain signal from movement or muscle noise, and epoch rejection, where contaminated segments simply get discarded rather than analyzed. This is one of the areas where quality varies enormously between clinics, since a rushed or under trained preprocessing pass can leave garbage data in the final report.
Once the signal is clean, your results get compared against a normative database, a large reference set of EEG recordings from people without known neurological conditions, matched by age and sometimes other demographic factors. Your data gets converted into z-scores, statistical measures of how far your value sits from the average for your age group. A z-score of 2.0 or higher (or negative 2.0 or lower) typically flags a value as statistically unusual, though “unusual” and “clinically meaningful” are not automatically the same thing.
Pro Tip: Ask your provider which normative database they use and how many subjects it contains. A database built on a few dozen people produces far shakier z-scores than one validated against thousands, and that single fact can change how much weight a finding deserves.
Topographic maps are the images most people picture when they hear “brain mapping.” Warm colors (red, orange) typically indicate higher power or activity in a region; cool colors (blue, green) indicate lower power. But raw color intensity alone tells you little without context, which is why clinicians distinguish between absolute power (the raw amount of activity in a frequency band at a location) and relative power (that activity as a percentage of total power across all bands at that location). A brain region can show high absolute theta simply because someone has thick skull bone slowing signal transmission, not because anything is neurologically wrong. Relative power helps control for that kind of individual variation.
Peak alpha frequency is another metric worth understanding. It’s simply the specific frequency, within the alpha band, where power peaks highest, usually somewhere between 9 and 11 Hz in healthy adults. Peak alpha frequency tends to slow with age-related cognitive decline and some injury states, which is part of why it shows up repeatedly in dementia and concussion research.
Coherence maps work differently. High coherence between two distant regions can suggest they’re overly synchronized, sometimes seen in certain seizure-prone networks, while unusually low coherence between regions that should communicate well can suggest disconnection, a pattern discussed in traumatic brain injury literature. Neither high nor low coherence is inherently “bad.” Context and location determine meaning.
A handful of patterns come up often enough in clinical qEEG reports that they’re worth naming directly:
Here’s the number that deserves real attention: a z-score comparison flags statistical outliers, but reviews of quantitative EEG in neuropsychiatric assessment are clear that qEEG functions as an adjunctive data source, not a diagnostic verdict. A statistically unusual finding on a topographic map is a data point to correlate with your symptoms, your history, and other testing, not a conclusion that stands on its own.
This is where overcalling becomes a real risk. Run enough statistical comparisons across enough brain regions and frequency bands, and some will land outside normal range purely by chance, the same multiple-comparisons problem that shows up across statistics generally. A clinician reading a report irresponsibly can turn ordinary variation into an alarming-sounding diagnosis. A clinician reading it carefully treats an isolated finding as a lead worth investigating, not a verdict worth repeating to a worried patient.
qEEG’s clinical footing is uneven by design, and that unevenness is worth understanding before you book a session.
Well-established adjunctive uses include:
Investigational but actively researched areas include mild traumatic brain injury, ADHD, depression, anxiety, and autism spectrum presentations. The debate in these areas isn’t whether qEEG detects real differences; group-level studies often do find them. The debate is whether those differences are consistent and specific enough, at an individual level, to reliably guide diagnosis rather than just describe a general trend. Ongoing neurodiagnostic research describes qEEG’s clinical relevance as expanding but still context-dependent, which is an honest way of saying the science is moving faster than consensus guidelines.
Where qEEG earns its keep most reliably in day-to-day practice is less about diagnosis and more about function: differential assessment alongside a full clinical picture, designing individualized neurofeedback protocols, and tracking whether a treatment is producing measurable electrophysiological change over time. Those three uses don’t require qEEG to diagnose anything. They just require it to describe brain activity accurately and consistently, which is exactly what it’s built to do.
One practical note before you schedule anything: insurance coverage for qEEG varies considerably, and payer policies frequently treat psychiatric applications as investigational, meaning coverage often hinges on documented medical necessity rather than routine screening. It’s worth understanding how coding and coverage work for neurofeedback-related services before you assume a session will be reimbursed.
The biggest technical pitfall in qEEG isn’t the recording. It’s the interpretation. Statistical comparison across dozens of regions and multiple frequency bands inevitably produces some outliers by chance alone, and normative databases themselves vary in size, age range, and demographic representation. A finding that looks alarming against one database might sit comfortably within normal range against another.
This is exactly why professional bodies have stepped in with formal guidance. The American Clinical Neurophysiology Society states plainly that QEEG techniques should be applied by clinicians highly skilled in EEG interpretation, not treated as an automated output anyone can read. The International QEEG Certification Board goes further, publishing minimum technical requirements covering acquisition standardization, artifact handling, and interpreter qualification as prerequisites for clinical use.
For your own peace of mind, a few direct questions to any provider go a long way:
That last question is the one that separates responsible practice from overreach. A practical checklist for evaluating clinic quality can help you compare providers before committing to a course of testing.
This is where qEEG earns its most practical value. Rather than guessing at generic training sites, clinicians use your individual map to choose electrode placement and specific frequency targets, so a person showing excess frontal theta might get a protocol built around theta reduction at that exact site, while someone with a notably slow peak alpha frequency might train toward shifting that peak upward. It’s targeted rather than one-size-fits-all.
Baseline testing followed by serial retesting, say every 20 sessions, documents whether measurable electrophysiological change is actually happening, not just whether you feel different. Feeling different matters too, but pairing it with objective data gives both you and your provider a clearer signal of progress.
qEEG-guided protocols increase precision, though outcomes still depend heavily on protocol fidelity and individual factors like sleep, stress, and consistency of attendance. Mapping the brain well is the starting point. What happens across dozens of training sessions afterward is what actually moves the needle, a point explained further in how operant conditioning shapes neurofeedback training.
At Brainrestoremeridian, qEEG brain mapping typically enters the picture during intake, when we’re building a clearer functional picture of what’s happening beneath your symptoms and helping patients learn how to regulate your nervous system through energy healing as part of comprehensive care. The typical pathway runs from testing to interpretation to a tailored plan, often combining neurofeedback with adjunct therapies like hyperbaric oxygen or laser therapy depending on your presentation.
We treat the map as one input among several, not a verdict delivered in isolation. Reports get reviewed by trained clinical staff, correlated against your history and other findings, and used to set specific, individualized neurofeedback targets rather than generic protocols. You can read more about what a qEEG session at our Meridian location involves before you book.
qEEG makes sense when symptoms have persisted, when you’re specifically planning neurofeedback, or when you want an objective baseline to measure change against later. It makes far less sense as a stand-alone diagnostic fishing expedition.
Ask providers about interpreter credentials, the normative database in use, and artifact handling before you book. And treat any clinic promising a definitive diagnosis from an automated printout, with no clinician review, as a red flag worth walking away from.
— Chad
Some clinics provide qEEG results read by clinicians who then design and adjust your neurofeedback protocol in the same practice, rather than handing you a report and sending you elsewhere to figure out what to do with it.
A typical initial visit includes intake, electrode-based qEEG recording, and a follow-up consultation where your map gets translated into a specific, individualized plan, whether that means neurofeedback, hyperbaric oxygen therapy, or another therapy suited to what your data actually shows. If you’re weighing whether qEEG-guided neurofeedback might help with anxiety symptoms specifically, our overview of neurofeedback’s real benefits for anxiety walks through what patients typically experience. Ready to see what your own brain map shows? Schedule an initial qEEG evaluation with a local qualified team and get a plan built around your actual results, not a generic template.
For readers who want to go deeper on the technical and evidentiary claims made above, these sources form the backbone of current qEEG practice guidance:
This article is general information, not a substitute for advice from a qualified doctor. Consult a qualified healthcare professional about your own circumstances before acting on anything here.